Profiling WebAssembly with pprof and wzprof
10th September 2024
Rajiv Ranjan Singh
Rajiv Ranjan Singh






package main

import "fmt"

func main() {
    fmt.Println("Hello wzprof!")
}
GOOS=wasip1 GOARCH=wasm go build -o main.wasm main.go
wzprof -sample 1 -memprofile /Users/rajiv.singh/Desktop/hello-wasm/memprofile.out ./main.wasm
wzprof -sample 1 -cpuprofile /Users/rajiv.singh/Desktop/hello-wasm/cpuprofile.out ./main.wasm
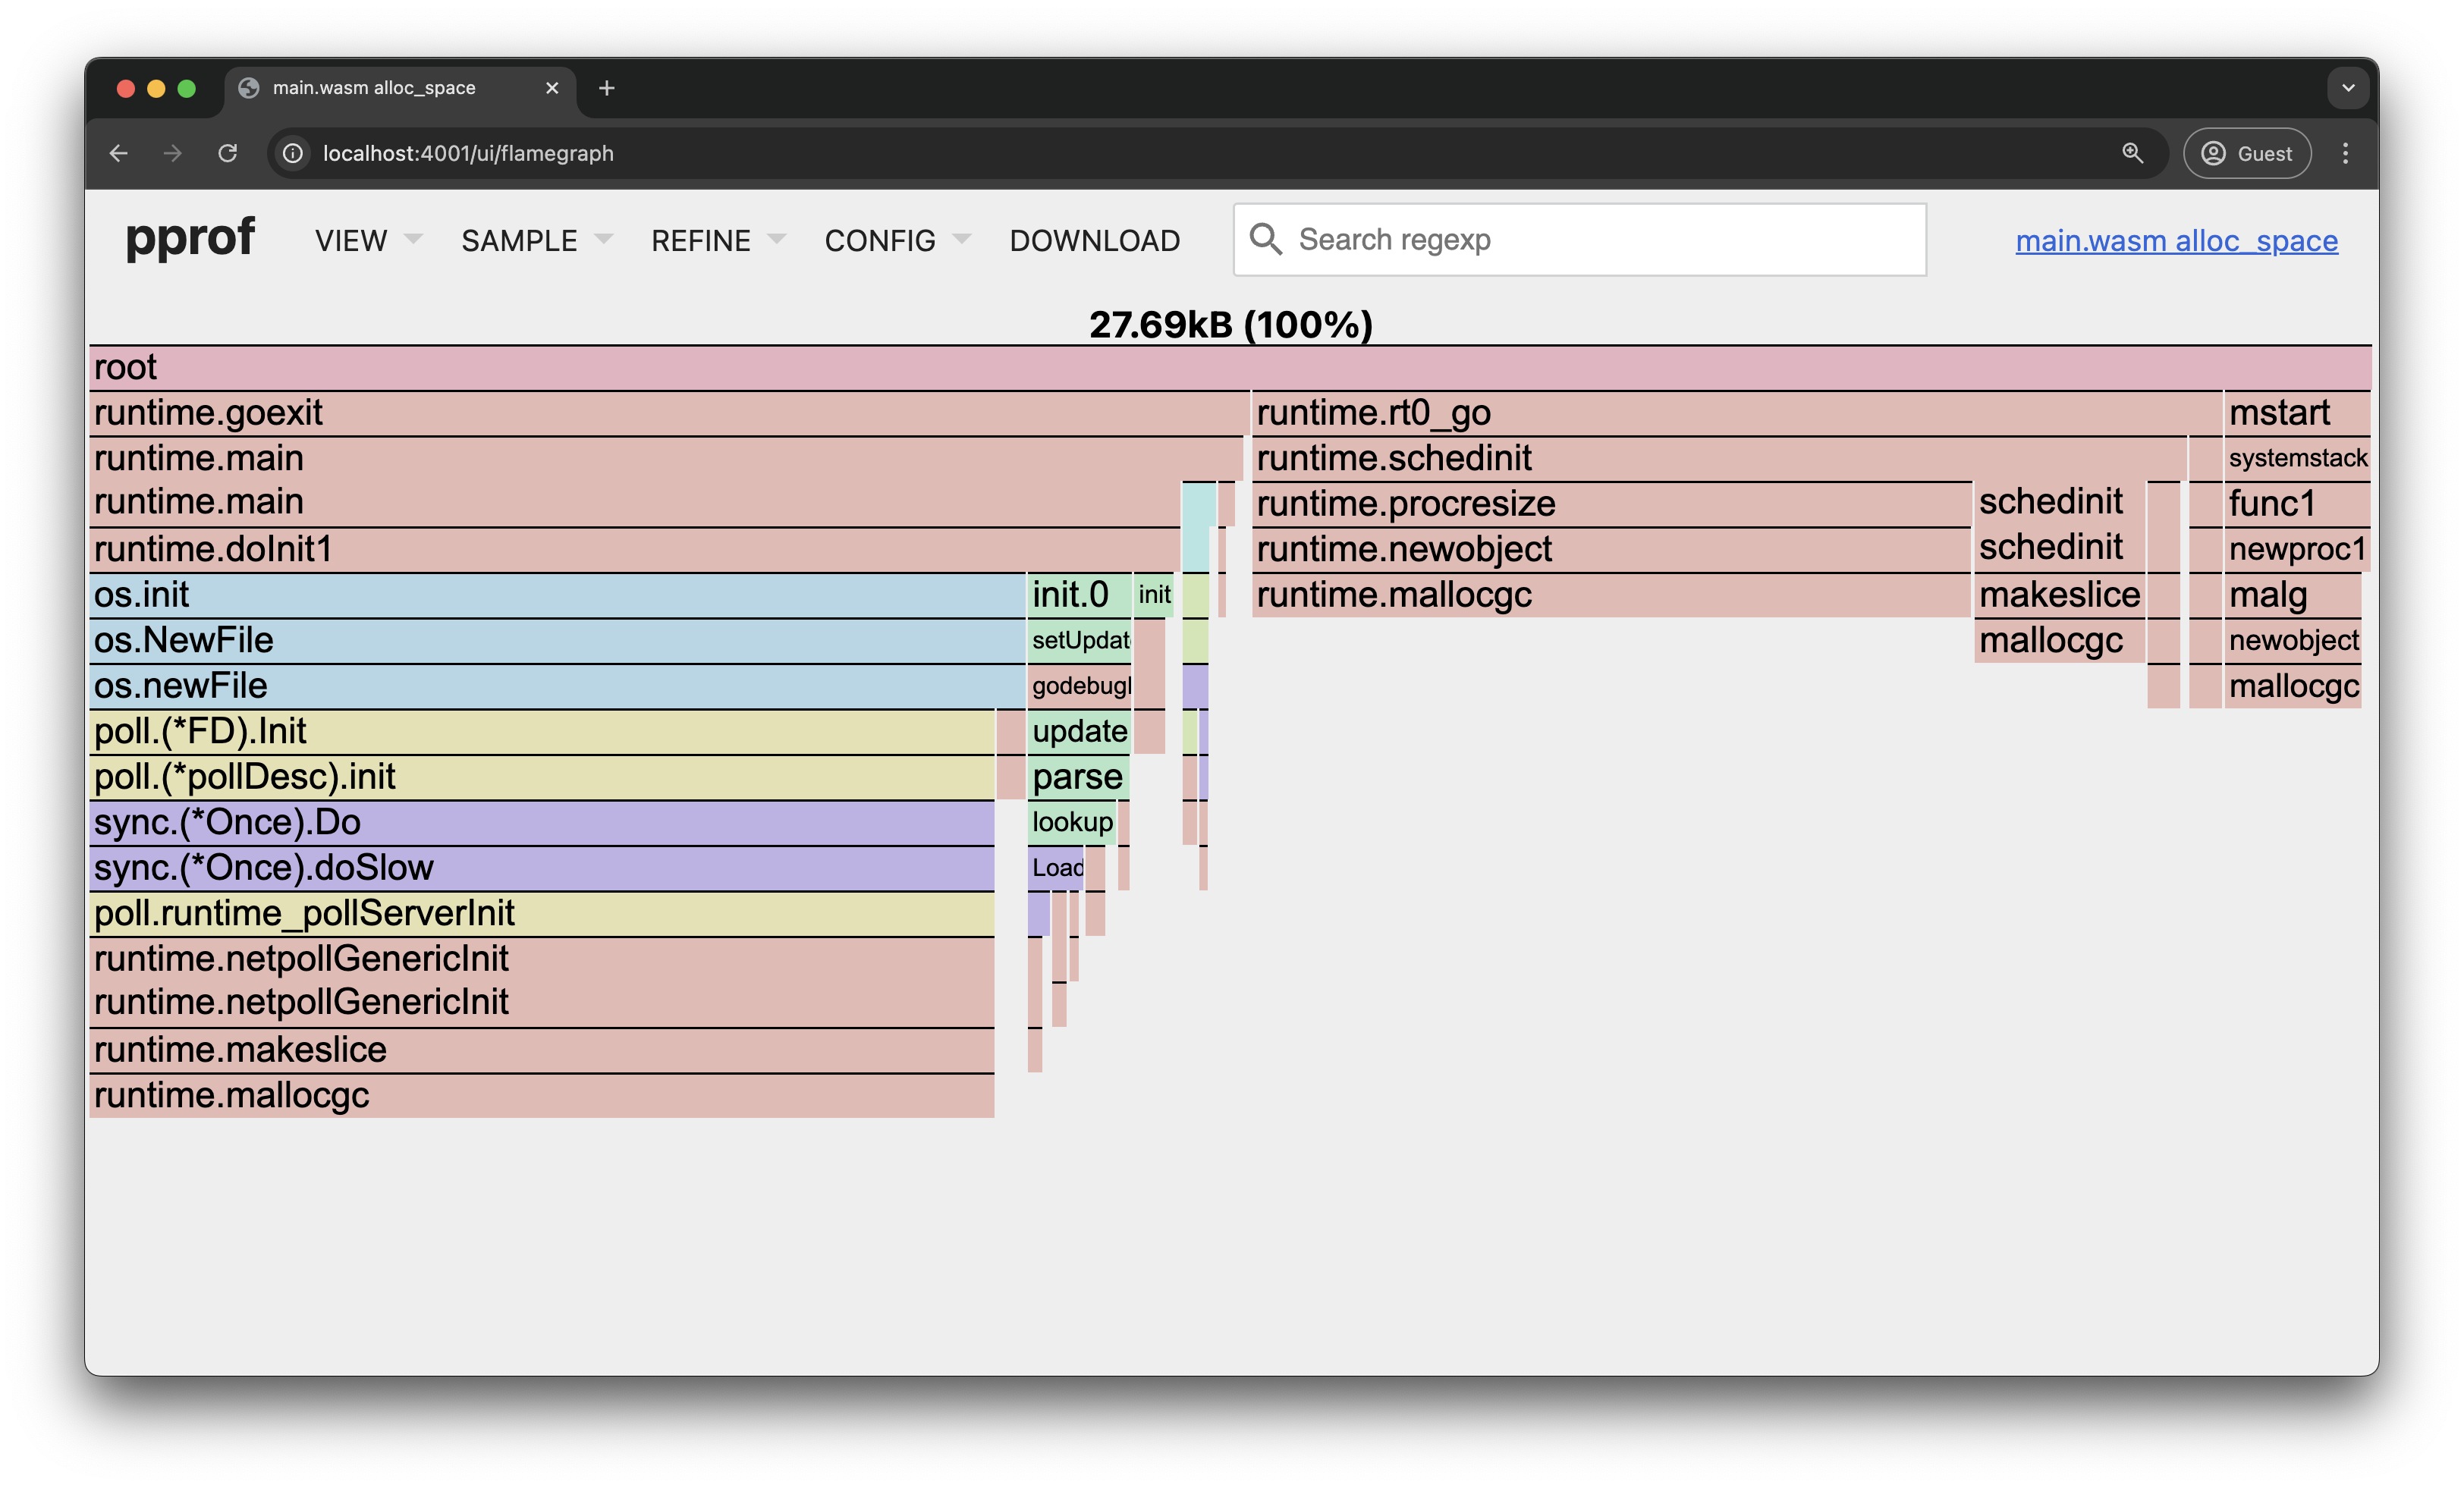
go tool pprof -http :4001 memprofile.out
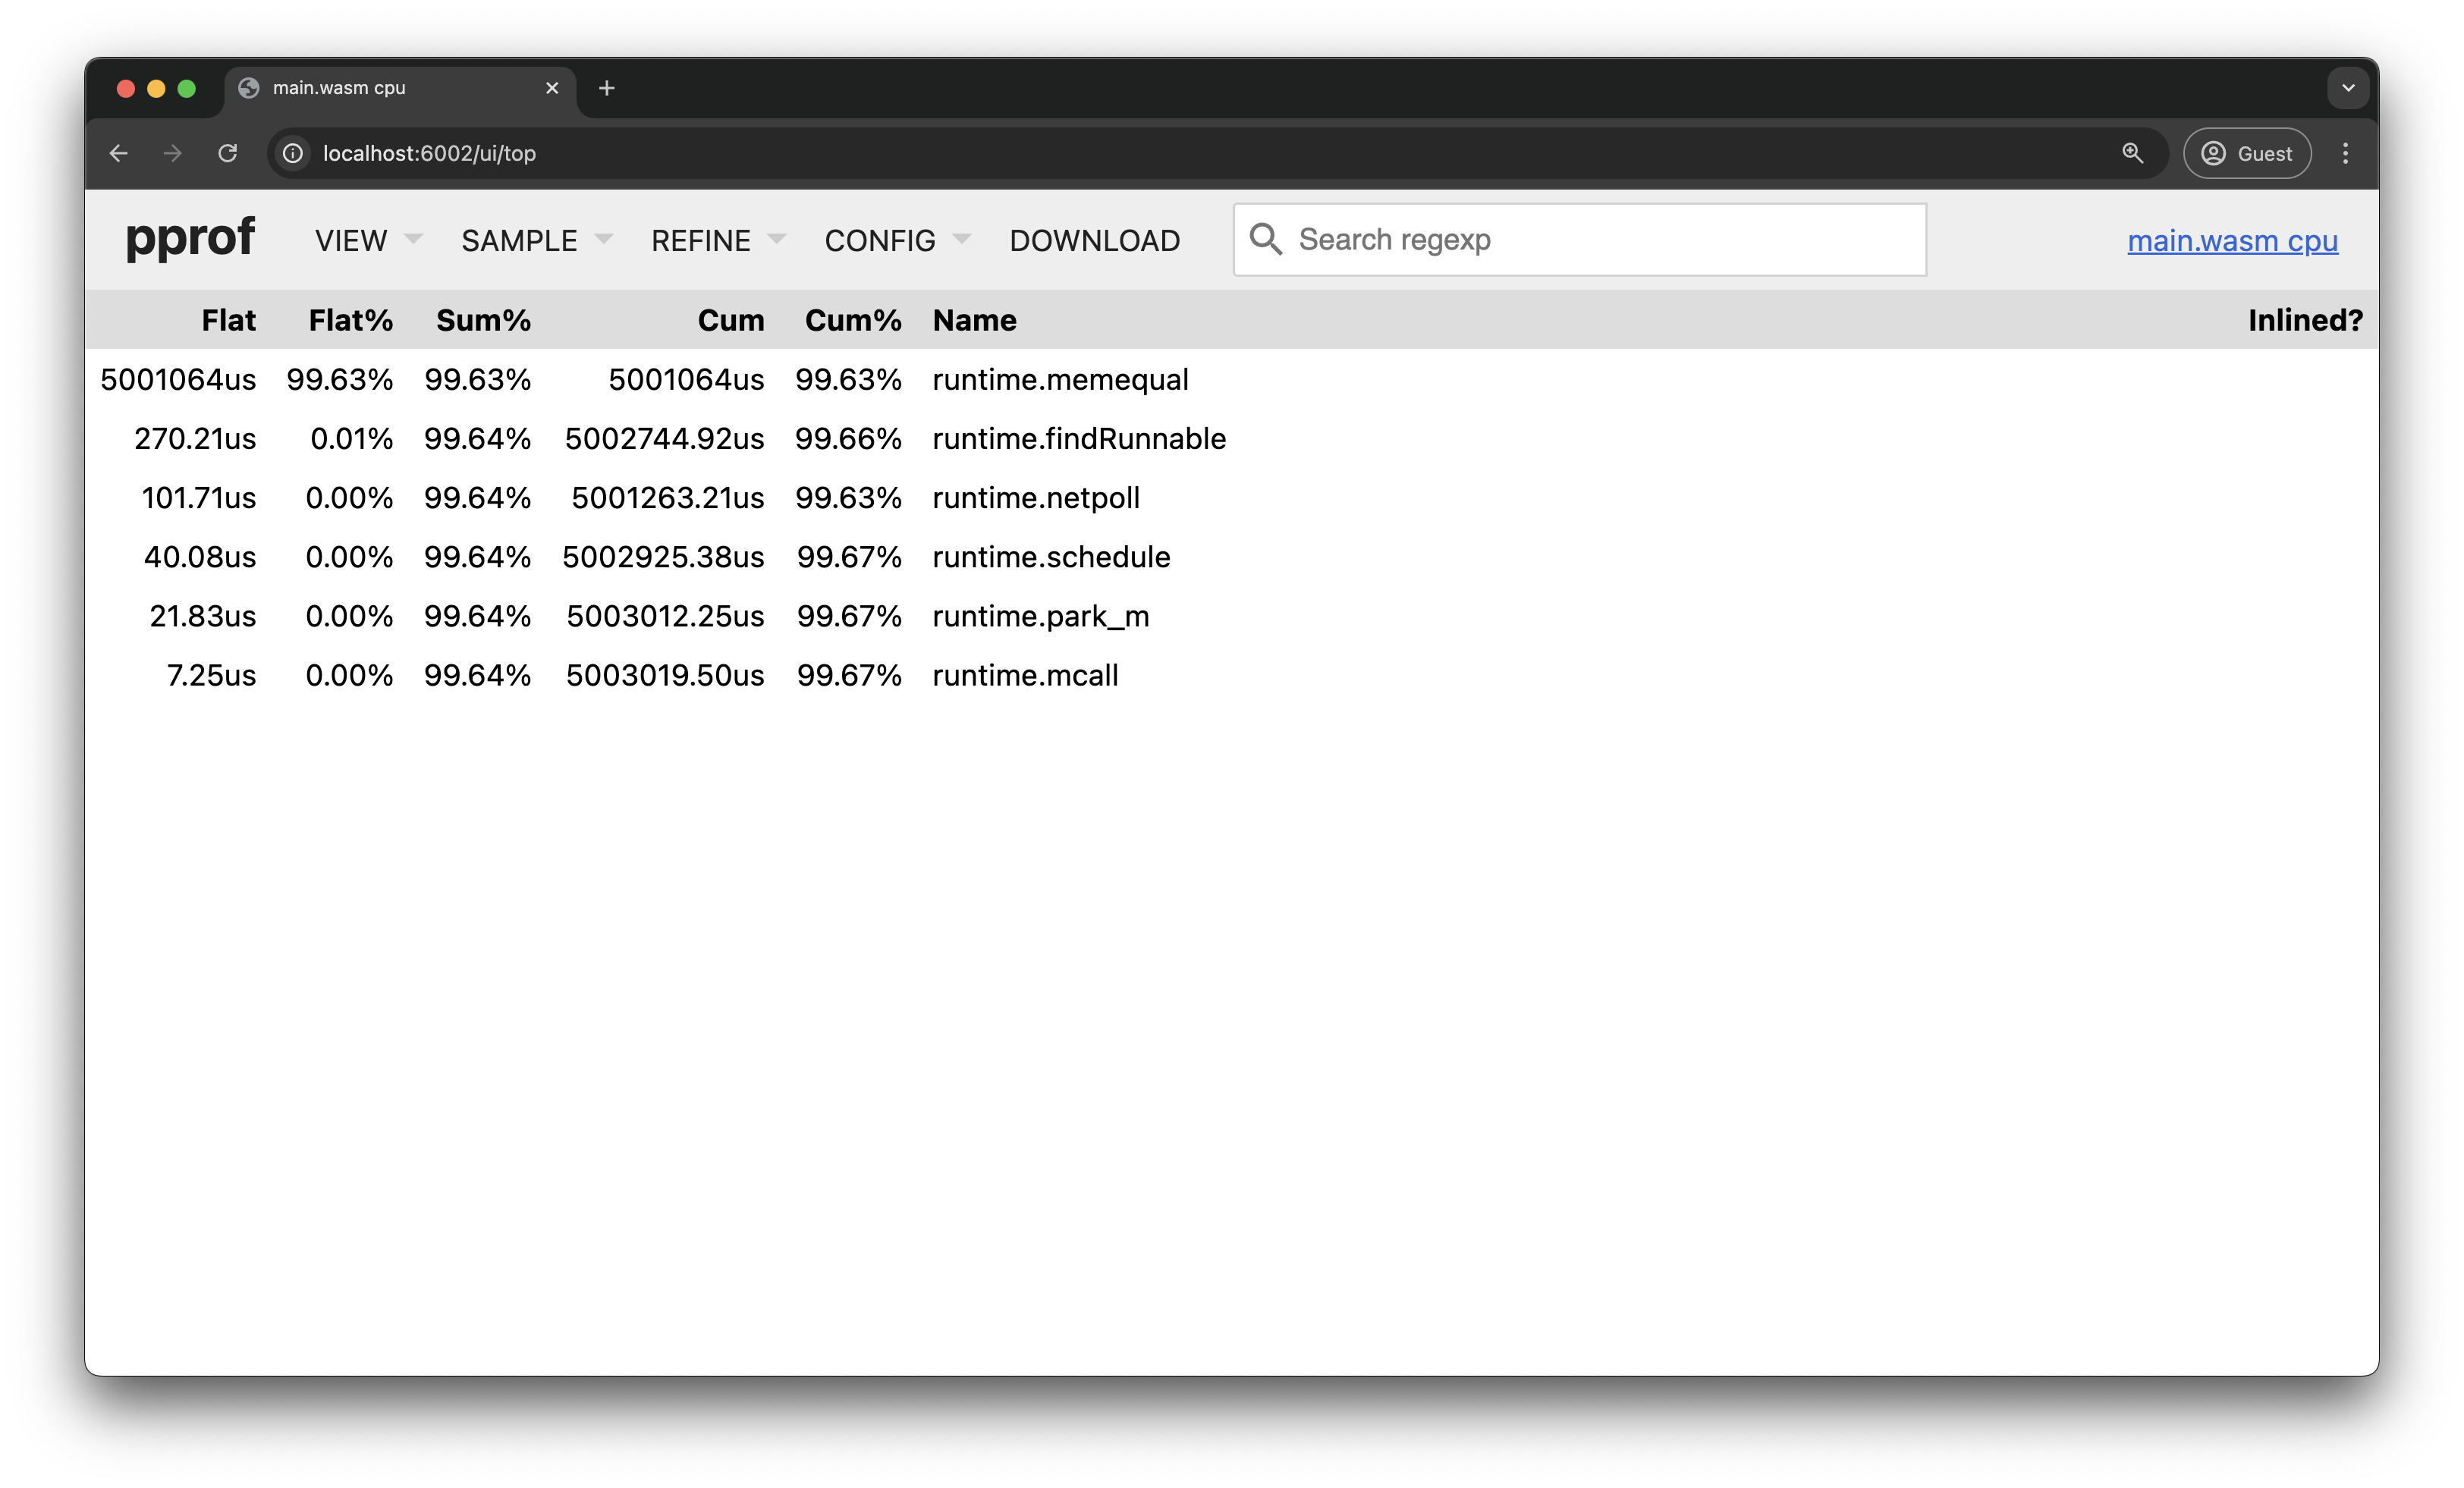
go tool pprof -http :6002 cpuprofile.out

Rajiv Ranjan Singh