WebAssembly Profiling with pprof and wzprof

11th December 2024

Rajiv Ranjan Singh

Naman Lakhwani
Agenda

2

Speaker - Rajiv Ranjan Singh

3

Speaker - Naman Lakhwani

4

What is Go?

5

What is Profiling?

6

Profiling with pprof

7

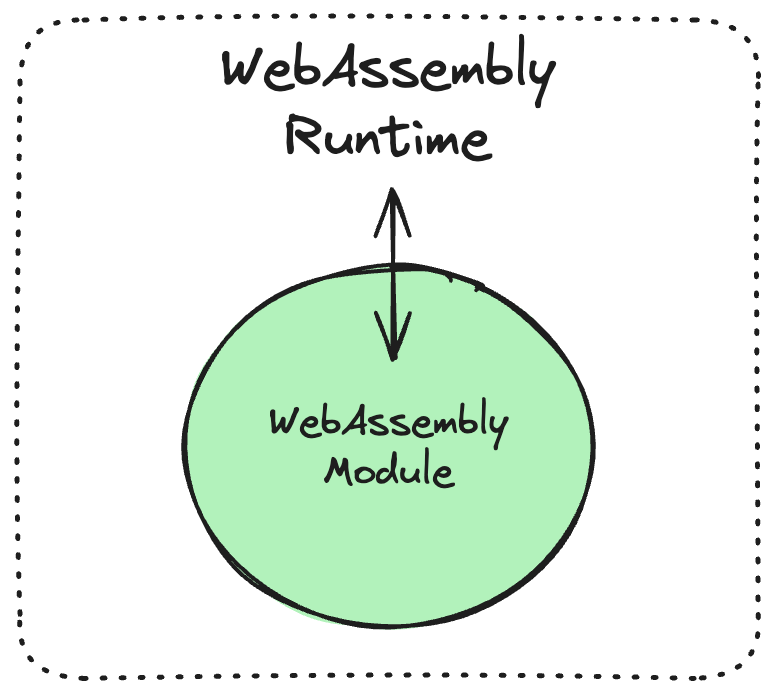
What is WebAssembly?

8

Profiling WebAssembly with wzprof

9

How profiling happens for a application?

10

CPU and Memory profiling with wzprof

11

Generate profilers using wzprof

package main

import "fmt"

func main() {
    fmt.Println("Hello wzprof!")
}
GOOS=wasip1 GOARCH=wasm go build -o main.wasm main.go
wzprof -sample 1 -memprofile /Users/rajiv.singh/Desktop/hello-wasm/memprofile.out ./main.wasm
wzprof -sample 1 -cpuprofile /Users/rajiv.singh/Desktop/hello-wasm/cpuprofile.out ./main.wasm
12

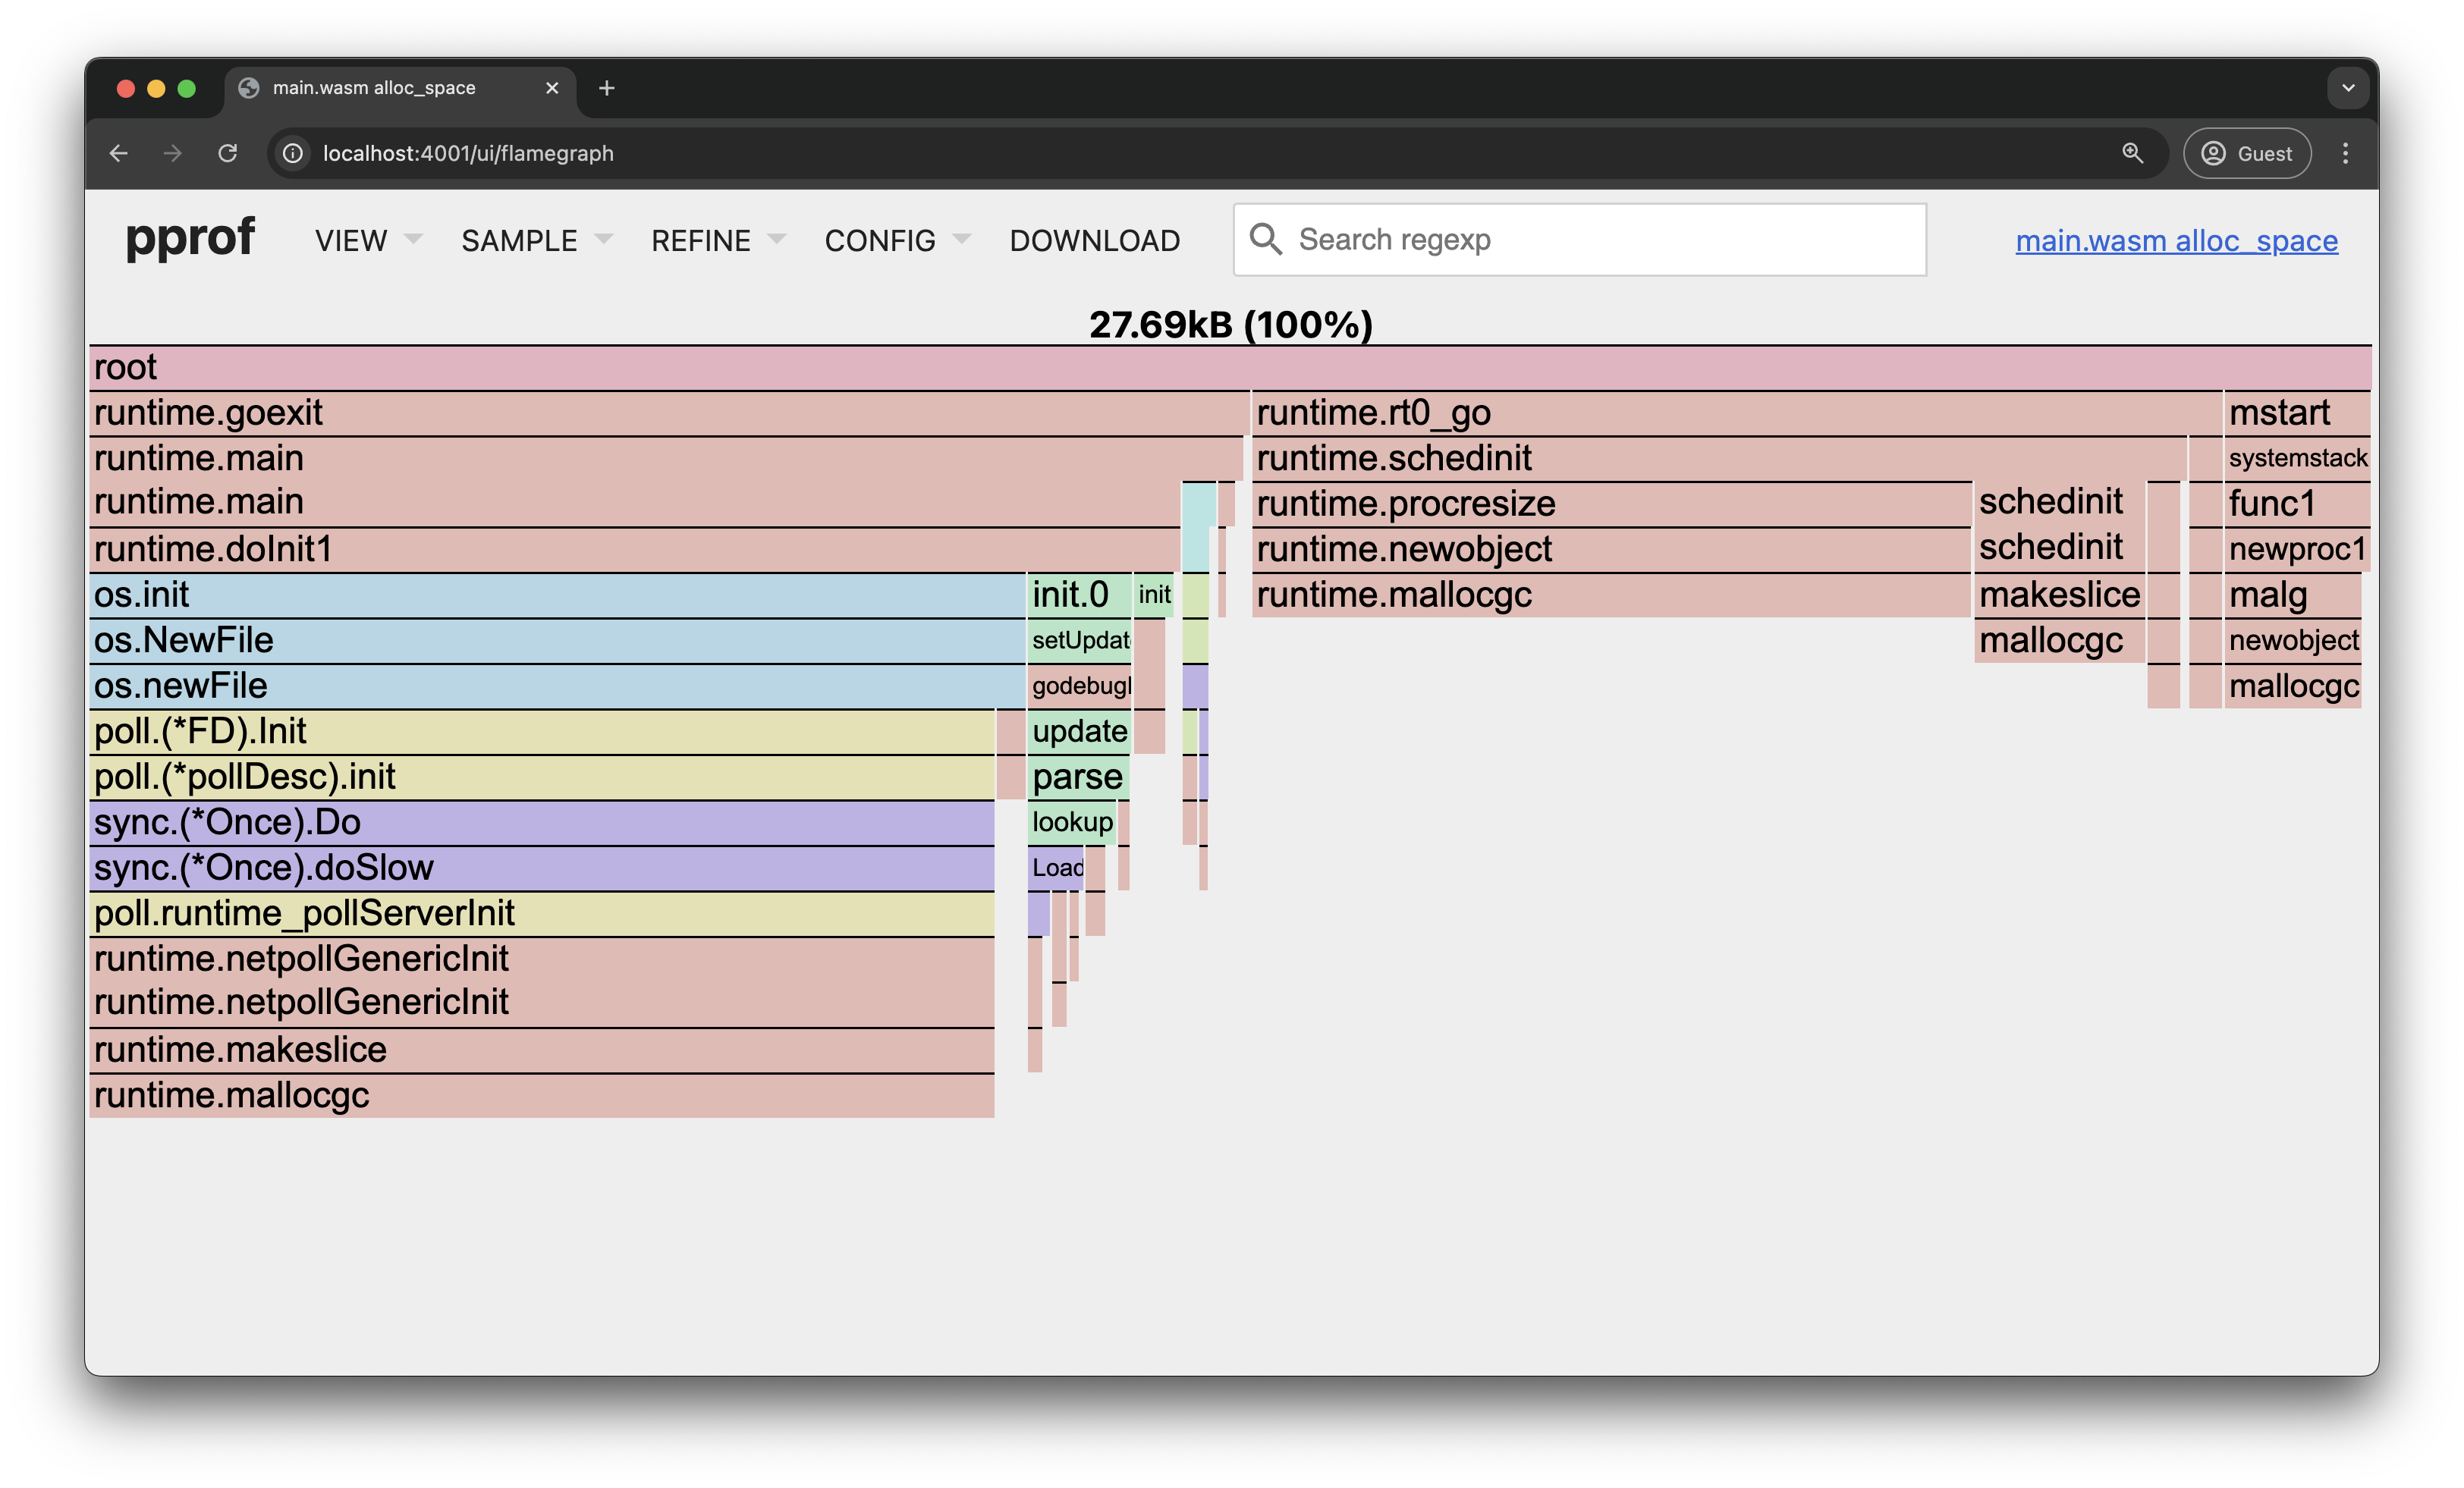
Visualize the memory profile

go tool pprof -http :4001 memprofile.out
13

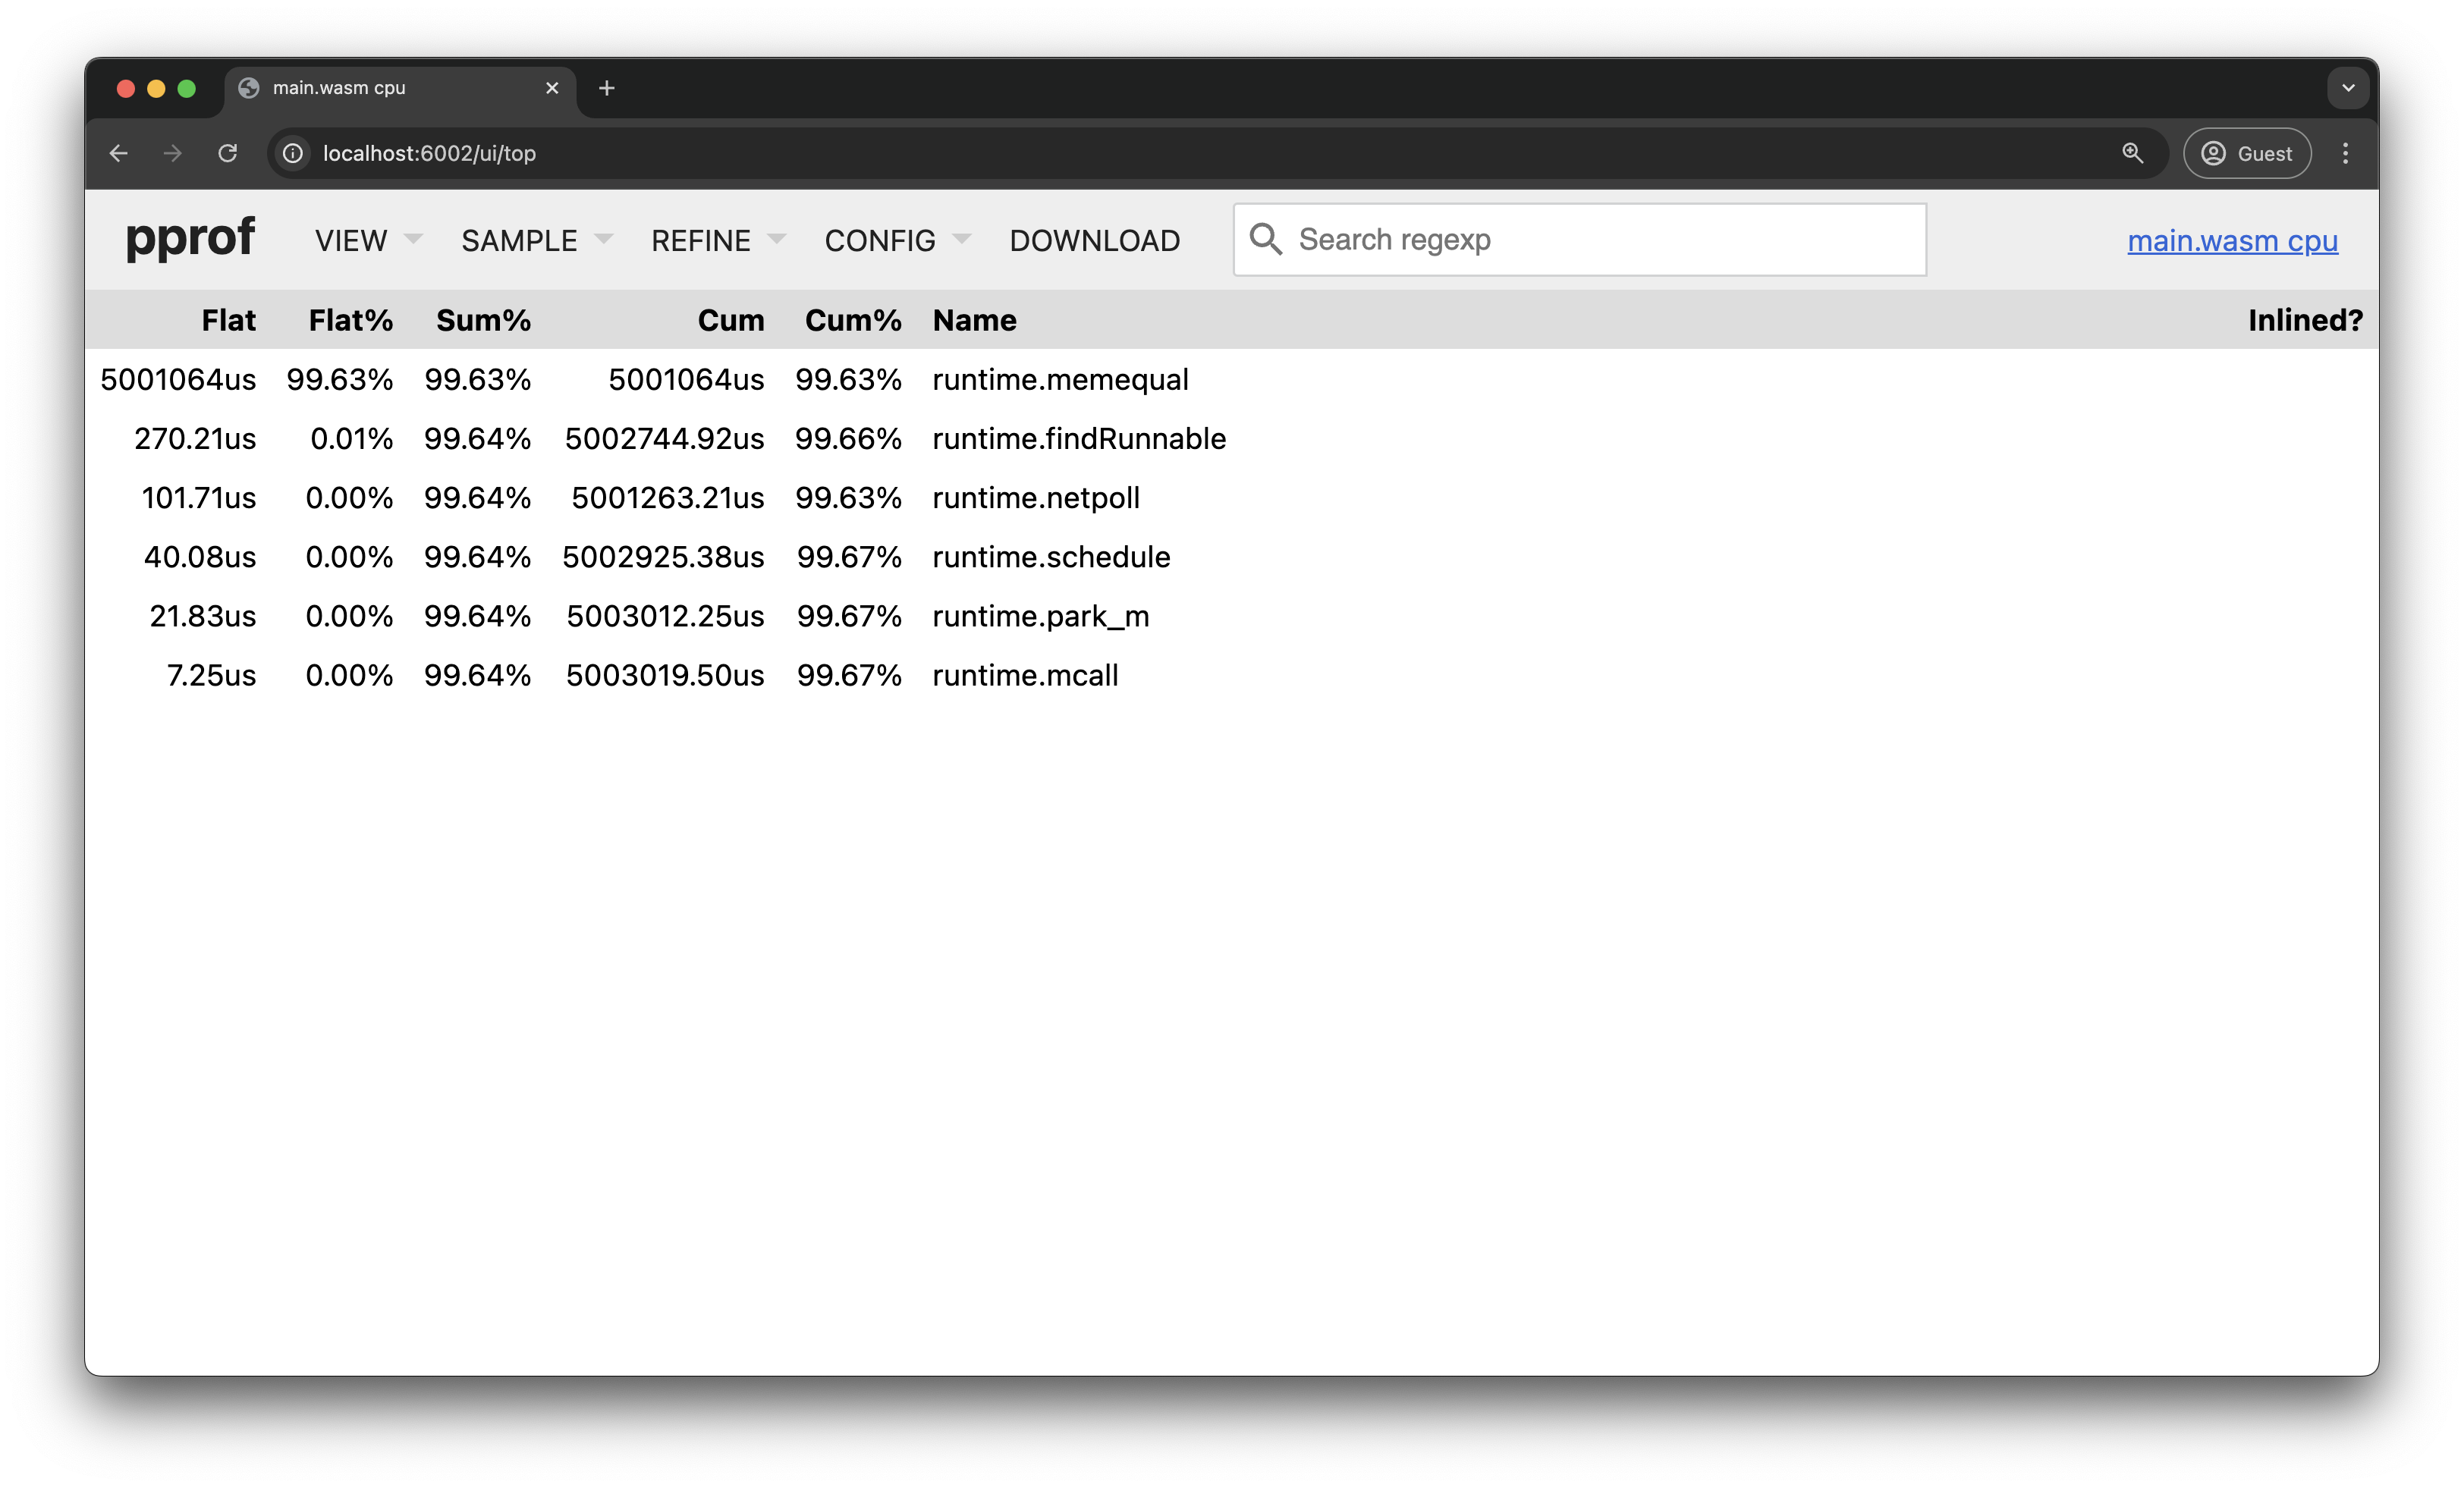
Visualize the cpu profile

go tool pprof -http :6002 cpuprofile.out
14

Future of profiling WebAssembly with wzprof

15

References

16

Thank you

Rajiv Ranjan Singh

Naman Lakhwani

Use the left and right arrow keys or click the left and right edges of the page to navigate between slides.
(Press 'H' or navigate to hide this message.)