Profiling is the part of performance work that stops you optimising the wrong thing. It is a critical practice for understanding where an application actually spends its time, as opposed to where you assume it does.
Go has unusually good tooling here: pprof is in the standard library, it costs almost nothing to enable, and it answers the only question that matters. WebAssembly, meanwhile, introduces a new realm of cross-platform execution that has historically lacked an equivalent — which is where wzprof comes in.
Some context on Go
Go, also known as Golang, is a programming language designed at Google in 2007 and open-sourced in 2009. It has gained popularity through its simplicity, efficiency, and strong concurrency model, which make it well suited to building scalable, high-performance applications.
- Multi-paradigm. Go supports procedural, functional, and concurrent programming styles.
- Memory safety. It has garbage collection and automatic memory management.
- Portability. Go compiles to many platforms, including WebAssembly, which makes it viable for both server and web environments.
- Tooling. The Go toolchain covers building, testing, profiling, and dependency management. Crucially, much of that toolchain remains usable when targeting WebAssembly, so developers keep access to Go's profiling tools even when the application runs inside a Wasm host.
Profiling with pprof
pprof is the most widely used profiling tool for Go. It measures CPU usage, memory allocation, blocking operations, and goroutine state, in real time.
- CPU profiling. Measures the time spent in different parts of the application.
- Memory profiling. Tracks heap allocations and identifies memory hotspots.
- Block profiling. Identifies goroutines blocked on synchronisation primitives such as mutexes.
- Goroutine profiling. Examines goroutine state to diagnose concurrency problems.
The Go runtime exposes profiling data over HTTP endpoints, which can be analysed on the command line or visualised in a browser. WebAssembly, although a different compilation target, can benefit from the same tooling if the profiling data can be produced at all — which is the whole problem.
What makes Wasm hard to profile
WebAssembly is a compact binary instruction format executing in a stack-based virtual machine. Originally designed for browsers, it now runs on servers, edge workers, and embedded systems.
- Portable bytecode. Modules compile to a low-level, efficient bytecode that runs on any host with a Wasm runtime.
- Sandboxed execution. Strong isolation makes it reasonable to run untrusted code.
- Host functions. Modules communicate with the host through imported and exported functions, which is how they reach anything outside the sandbox.
The sandbox is the entire point — it is what makes running untrusted code sensible — but isolation cuts both ways. The usual profiling mechanisms depend on exactly the access the sandbox exists to deny. You get portability and lose observability, which is a bad trade to discover late.
In the Go ecosystem, Wasm is a compilation target via GOOS=wasip1 GOARCH=wasm. The resulting module runs anywhere with a WASI runtime, which is very useful and, until recently, effectively opaque once running.
The approach wzprof takes
The trick is to instrument the runtime rather than the guest.
wzprof is built on Wazero (opens in a new tab), a lightweight WebAssembly runtime written in Go with no CGo dependency. Wazero exposes a function listener API — a hook that fires on every guest function call. wzprof attaches to it, records stack traces and timings, and writes the result in pprof's own format.
Three consequences follow, and they are more interesting than they first appear.
- Cross-language profiling. The instrumentation sits at the bytecode level, so a module compiled from Rust, C, Zig, or Kotlin profiles exactly like one compiled from Go. You are not depending on any particular language runtime cooperating.
- Uniform function instrumentation. Every WebAssembly function call is instrumented and its execution captured, in the same way
pprofhandles Go functions natively. It does not matter what the module was compiled from;wzproftreats it as bytecode. - Ordinary pprof output. Because the profiles are pprof-format and the tool can expose pprof-compatible HTTP endpoints, everything already built for pprof works unchanged —
go tool pprof, flame graphs, and continuous profiling systems such as Grafana's Pyroscope or Polar Signals' Parca.
Generating a profile
Take something minimal:
package main

import "fmt"

func main() {
	fmt.Println("hello, wzprof")
}
Build it for WASI:
GOOS=wasip1 GOARCH=wasm go build -o main.wasm main.goThen run it under wzprof, once for each profile type:
wzprof -sample 1 -cpuprofile ./cpuprofile.out ./main.wasm
wzprof -sample 1 -memprofile ./memprofile.out ./main.wasm
The -sample flag sets the sampling rate, and -cpuprofile and -memprofile specify where each profile is written. Sampling everything is fine for a short program and expensive for a real one — this is the knob you turn when instrumentation overhead starts distorting what you are trying to measure.
Open the result with the standard tool:
go tool pprof -http :4001 memprofile.outThat launches a local HTTP server presenting the profile in an interactive web interface, where you can explore allocations and look for leaks or inefficiencies.
Reading it
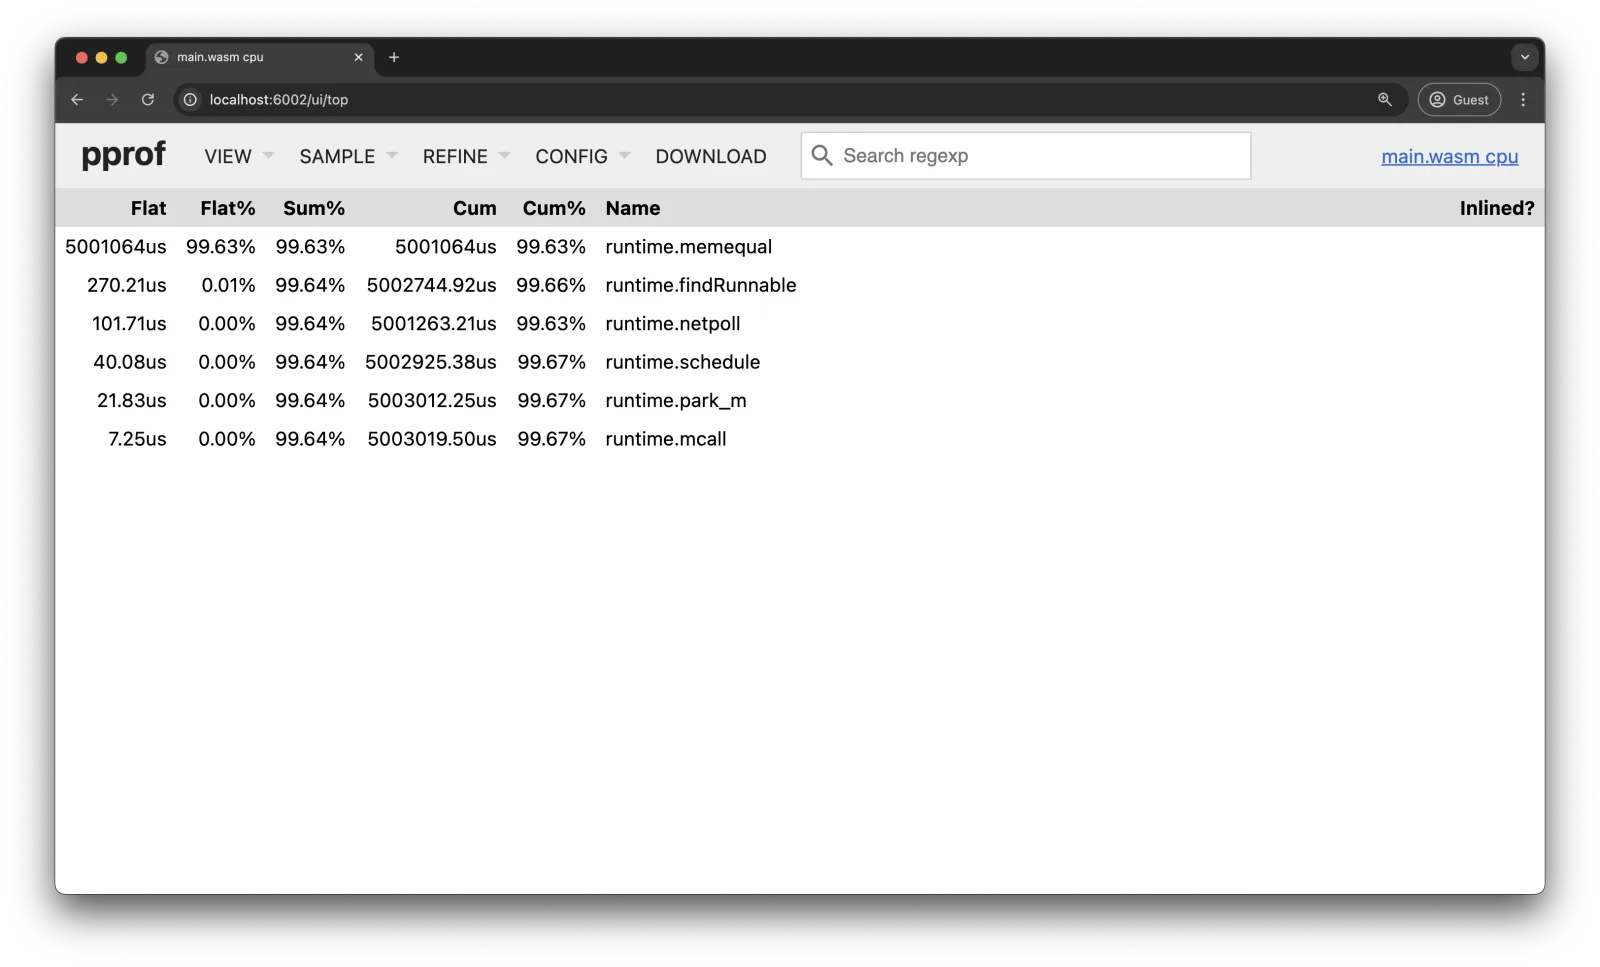
The CPU profile in the top view:
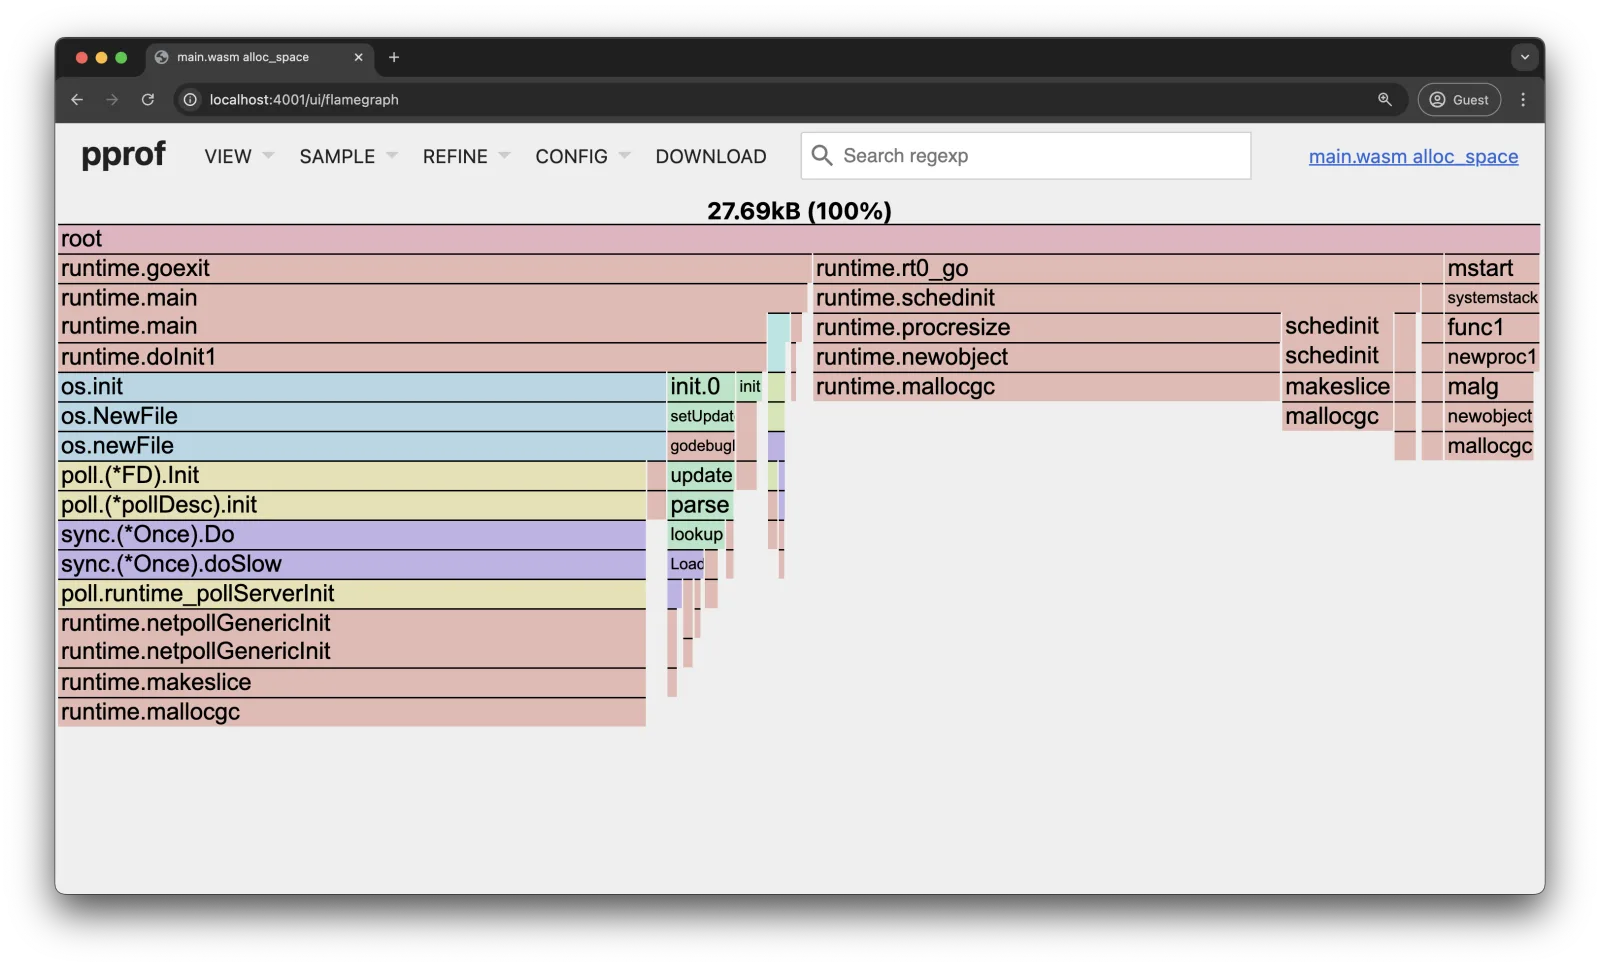
And allocations as a flame graph:
NOTE
Look at what these are actually showing. The CPU profile is 99.63% runtime.memequal; the allocation graph is 27.69 kB, essentially all of it runtime.schedinit, os.init, and friends.
That is not a finding — it is what you get when you profile a program whose entire body is one Println. Startup dominates because there is nothing else to measure.
I have left these in because they are honest about what the tool produces on a trivial input, and because recognising "this profile is all runtime startup" is a genuinely useful skill. On a real workload the guest's own functions appear and the runtime frames recede into the background. If they do not, your program is not doing enough work to be worth profiling.
Where it is useful
The obvious case is a Go service compiled to Wasm for edge deployment, where you want the profiling story you would have had natively.
The more interesting case is the cross-language one. If you are running plugins compiled from several languages inside one host, wzprof gives you a single profiler across all of them — where otherwise you would need each language's own tooling, assuming it survives the Wasm target at all.
That is the real argument for instrumenting at the runtime layer. Language-specific profilers give richer detail; a runtime-level profiler gives you coverage, and coverage is what you lack when the module could have come from anywhere.
What comes next
wzprof is a significant step for WebAssembly profiling, and it opens possibilities across server environments, browser-based applications, and embedded systems. Several developments look promising from here.
- Deeper integration. Profiling that follows execution from the guest module, through host functions, down to the kernel, would be a substantial improvement over profiling any one layer in isolation.
- eBPF and WebAssembly. As eBPF-based profiling continues to gain traction, an intersection with Wasm profiling could provide considerably more granular insight.
- Interpreted languages. Future versions may extend to profiling interpreted languages running inside WebAssembly, such as Python or JavaScript, which are currently the hardest case.
Conclusion
Profiling WebAssembly applications matters for the same reason profiling anything matters: without it you optimise from intuition, and intuition about performance is usually wrong. pprof and wzprof together provide a workable way to monitor CPU and memory behaviour inside Wasm modules, whether you are tuning a Go application or profiling a module compiled from something else entirely.
The tooling is young and the WASI ecosystem is still moving. But the direction is right: portability that costs you observability is not portability you can run in production, and closing that gap at the runtime layer is the approach most likely to generalise.